Tableau has long stood as a beacon for such endeavors, but as we step into 2024, a host of Tableau alternatives have emerged, promising to cater to the diverse needs of data analysts, engineers, and business users alike. These alternatives not only challenge the status quo but also offer unique features and capabilities that merit consideration.
What is Tableau?
Tableau is a powerful data visualization tool designed for data analysts and business users to create interactive and shareable dashboards. It excels in transforming raw data into easily understandable visual formats, aiding in data-driven decision-making processes.
Benefits of using Tableau

1. Unparalleled Data Visualization Capabilities
Tableau shines as a premier data visualization tool, transforming complex and voluminous data into comprehensible and interactive dashboards. Its robust data visualization capabilities enable users to create visualizations that make trends, outliers, and patterns in data easily identifiable.
By harnessing Tableau, organizations can visualize complex data sets from multiple data sources, including both structured and unstructured data, facilitating a deeper understanding and more insightful analysis of their data.
2. Seamless Integration with Multiple Data Sources
One of Tableau’s standout features is its ability to integrate effortlessly with a vast array of data sources, from SQL databases to cloud services like Google Analytics.
This data integration prowess ensures that users can pull in raw data from diverse origins, streamline data preparation, and generate actionable insights without the need for extensive data processing. This capability is crucial for data teams working with both traditional databases and modern data ecosystems.Article Sponsored Find something for everyone in our collection of colourful, bright and stylish socks. Buy individually or in bundles to add color to your sock drawer!
3. Intuitive User Interface and Drag-and-Drop Functionality
Tableau’s intuitive user interface and drag-and-drop functionality democratize data analysis, making it accessible to users of all skill levels.
This ease of use encourages business users and data analysts alike to explore data, perform ad hoc analysis, and create interactive dashboards without a steep learning curve. This approach not only speeds up the data discovery process but also fosters a culture of data-driven decision-making within organizations.
4. Advanced Analytics and Predictive Analysis
Beyond traditional data visualizations, Tableau offers advanced analytics features, including predictive analytics and machine learning capabilities.

These tools allow data scientists and analysts to dive deeper into their data, uncovering not just what has happened but also forecasting future trends based on historical data. This predictive analysis capability is invaluable for organizations looking to stay ahead in their industry by making proactive, data-informed decisions.
5. Comprehensive Data Management and Security
Tableau does not just excel in data visualization and integration; it also provides robust data management and security features. Ensuring data security is paramount, especially when dealing with sensitive or proprietary information.
Tableau’s platform enables organizations to manage access controls, ensure data integrity, and comply with data protection regulations, making it a trusted tool for businesses prioritizing data security.
6. Collaboration Tools for Enhanced Team Productivity
Collaboration is at the heart of Tableau’s design, with features that promote teamwork and shared insights.

Users can create reports, share dashboards, and collaborate on data visualizations in real-time, enhancing team productivity and decision-making.
These collaboration tools are especially beneficial for data teams needing to work closely with business users, analysts, and other stakeholders across an organization.
7. Flexibility and Scalability for Growing Data Needs
As organizations grow, so do their data analysis and visualization needs. Tableau is designed to scale with businesses, accommodating increasing data volumes and more complex data analysis requirements without compromising performance.
Whether it’s expanding the types of data sources integrated or requiring more advanced features for data analytics, Tableau’s platform can adapt to the evolving needs of businesses, ensuring they continue to derive maximum value from their data.
Why Should You Look for Alternatives to Tableau
1. Cost-Effectiveness and Accessibility
When evaluating business intelligence tools, cost is a critical factor, especially for small to medium-sized businesses or startups.
Alternatives to Tableau, such as Microsoft Power BI, offer competitive pricing models, including free trials and scalable subscriptions, making them more accessible to companies with limited budgets. These tools provide essential BI capabilities, enabling businesses to analyze data, create dashboards, and generate reports without a significant financial commitment.
2. Specialized Analytics Needs
While Tableau serves as a comprehensive business intelligence platform, some organizations might require specialized analytics tools tailored to their specific industry or data types.
Tools like IBM Cognos Analytics offer advanced analytics capabilities, including predictive analysis and machine learning for big data.
These specialized tools can provide more targeted insights and are better suited for organizations with unique data analysis and visualization needs.

3. Integration with Existing Software Ecosystems
Organizations often seek BI tools that seamlessly integrate with their existing software ecosystems. Microsoft Power BI, for example, offers deep integration with other Microsoft products and services, enhancing productivity and collaboration.
This level of integration ensures that data teams and business users can easily access, query, and visualize data without the need for extensive IT support, making it a compelling Tableau alternative for businesses already embedded in the Microsoft ecosystem.
4. Customization and Flexibility
Different organizations have varying requirements for data visualization and analysis. Some alternatives to Tableau offer greater customization and flexibility in terms of data models, reporting tools, and dashboard creation.
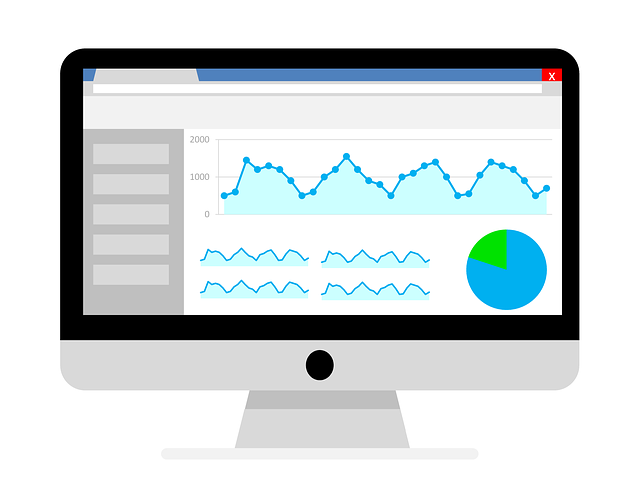
This customization allows data analysts and engineers to tailor the tools to their specific data sources and business insights needs, providing a more personalized analytics experience.
5. User-Friendly Self-Service Capabilities
Self-service BI tools empower non-technical users to analyze and visualize data without relying heavily on IT or data teams. Alternatives like Power BI and Qlik offer intuitive user interfaces and drag-and-drop functionalities that simplify the data analysis process.
These self-service capabilities enable business users to query data, interpret results, and create interactive reports and visualizations on their own, fostering a more data-driven culture within the organization.
6. Enhanced Collaboration and Sharing Features
Collaboration is key to leveraging business intelligence across an organization effectively. Some Tableau alternatives focus on enhanced collaboration tools that facilitate easier sharing of insights, interactive reports, and dashboards.
These features ensure that teams can work together more efficiently, share business analytics insights in real-time, and make informed decisions faster.
7. Advanced Embedded Analytics
For companies looking to integrate analytics directly into their applications or services, alternatives to Tableau with strong embedded analytics capabilities are worth considering.
These BI tools offer APIs and SDKs for integrating advanced analytics and interactive visualizations into custom applications, enhancing the value of products and services by providing actionable insights directly to end-users.
8. Diverse Analytical Approaches for Complex Data
Organizations dealing with highly complex or varied data might find that other tools offer analytical approaches better suited to their needs.
For example, IBM Cognos Analytics provides robust capabilities for analyzing unstructured data, predictive analytics, and machine learning, offering a more comprehensive understanding of complex data sets. Exploring Tableau alternatives can reveal tools that better match the specific analytical demands and data visualisation challenges of an organization.
Best Tableau Alternatives
Microsoft Power BI: A Dynamic Tableau Alternative
Unlocking Business Insights with Ease
Microsoft Power BI stands out as a premier choice among Tableau alternatives, especially for organizations aiming to elevate their data analysis and visualization strategies.
This comprehensive business intelligence platform empowers data teams with advanced tools to transform raw data into meaningful insights.
- Seamless Data Integration: Power BI excels in integrating data from a myriad of sources. Whether it’s cloud services, on-premises databases, or Excel spreadsheets, Power BI makes data pooling effortless, setting a solid foundation for comprehensive data analytics.
- Intuitive Design and Usability: With its user-friendly interface and drag-and-drop functionality, Power BI simplifies the creation of interactive dashboards and visualizations. This ease of use drastically reduces the steep learning curve often associated with advanced BI tools, making it accessible for data analysts and business users alike.
- Robust Collaboration and Sharing: Collaboration is at the heart of Power BI. Its integration with Microsoft’s ecosystem, including Teams and Office 365, enhances team coordination and decision-making. Sharing insights, interactive reports, and dashboards across departments becomes a streamlined process, fostering a culture of data-driven decision-making.
- Advanced Analytics for All: From basic data visualizations to complex model predictions, Power BI offers a range of analytics capabilities. Embedded analytics and the ability to create custom visuals cater to the specific needs of businesses, ensuring that insights are both profound and actionable.
Why Choose Power BI?
Choosing Microsoft Power BI as a Tableau alternative means investing in a platform that not only matches the robust data visualization and business intelligence capabilities of its competitors but also enhances user experience with intuitive design and superior integration capabilities.
Its affordability, coupled with a generous free trial, makes it an attractive option for businesses of all sizes looking to harness the power of their data.
Whether you’re a seasoned data analyst or a business user eager to delve into data discovery, Power BI offers the tools and flexibility needed to extract maximum value from your data assets.
Qlik Sense: Revolutionizing Data Interpretation
As businesses delve deeper into the digital age, the demand for sophisticated business intelligence software that not only visualizes but also interprets data meaningfully has surged.

Qlik Sense stands tall as an innovative solution, providing a unique approach to data analytics that caters to the needs of data engineers, data teams, and business analysts alike.
- Intuitive Data Interaction: Qlik Sense’s modern analysis system invites users to explore and interact with data in a natural, intuitive way. This platform democratizes data analytics, making it accessible for users across the organization to derive insights and make informed decisions.
- Comprehensive Data Integration: A hallmark of Qlik Sense is its exceptional ability to consolidate data from diverse sources into a single, unified view. This seamless integration ensures that data teams can work with a holistic picture of their data landscape, enhancing the accuracy and relevance of their analyses.
- Advanced Reporting Tools: With Qlik Sense, creating detailed, insightful reports becomes a breeze. This powerful reporting tool allows for the customization of dashboards and reports to meet the specific requirements of different stakeholders, ensuring that the right insights reach the right people at the right time.
- Collaborative Analytics Environment: Qlik Sense fosters a collaborative workspace for data teams, enabling shared insights and collective decision-making. This collaborative approach ensures that knowledge is not siloed but rather shared across departments, maximizing the impact of data-driven strategies.
Empowering Data Engineers and Analysts
For data engineers, Qlik Sense offers robust backend capabilities, including data preparation and management features that streamline the process of making raw data analytics-ready. Its sophisticated engine effortlessly handles complex data source integration, allowing engineers to focus on innovation rather than data wrangling.
A Complement to Tableau Desktop
While some may see Qlik Sense as a competitor to Tableau Desktop, it also serves as a complementary tool in an organization’s BI toolkit.
Its unique associative model and in-memory processing offer a different angle for interpreting data, providing insights that might be overlooked by other tools.
This makes Qlik Sense an invaluable asset for businesses looking to deepen their analytical capabilities beyond what Tableau Desktop offers.
IBM Cognos Analytics: A Vanguard in Advanced Data Analysis and Data Visualization Tool
In the quest for Tableau alternatives that offer robust capabilities in data analysis and visualization, IBM Cognos Analytics stands out as a sophisticated choice for organizations aiming to elevate their business intelligence practices.
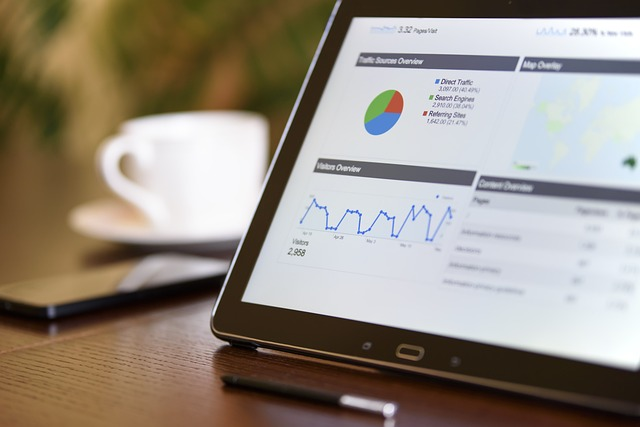
It marries advanced analytics with user-friendly tools to create a powerful, intuitive platform for data analysts and business teams.
- Cutting-Edge Data Visualization: IBM Cognos Analytics takes data visualization to the next level, offering a wide array of tools that enable users to create interactive dashboards and visualizations. This platform brings data to life, making complex information easy to understand and act upon.
- Comprehensive Data Integration: With its ability to integrate seamlessly with various data sources, IBM Cognos Analytics ensures that data teams have unfettered access to the data they need. Whether the data resides in cloud storage, on-premises databases, or in external applications, IBM Cognos makes it accessible for analysis and visualization.
- Advanced Analytics for Deeper Insights: Beyond standard reporting, IBM Cognos Analytics offers advanced analytics capabilities. This includes predictive analytics, which helps organizations anticipate trends and make proactive decisions. Data analysts can delve into the intricacies of their data, uncovering insights that drive strategic business actions.
- Empowering Collaboration: Collaboration tools within IBM Cognos Analytics foster a shared understanding of data insights. Teams can work together on interactive reports and dashboards, sharing insights and making informed decisions collectively. This collaborative environment ensures that insights are maximized across the organization.
- Accessibility and Ease of Use: Despite its advanced capabilities, IBM Cognos Analytics is designed with the user in mind. It offers an intuitive interface that simplifies the creation of interactive dashboards and reports. This user-centric design democratizes data analytics, making it accessible to users with varying levels of expertise.
- Free Trial and Scalability: IBM Cognos Analytics offers a free trial, allowing businesses to explore its capabilities before committing. This risk-free exploration, coupled with the platform’s scalability, ensures that organizations can grow their BI capabilities in tandem with their evolving needs for each data team.
A Comprehensive Business Intelligence Solution
IBM Cognos Analytics represents a comprehensive solution for businesses seeking advanced business intelligence tools.

It not only provides the means to interpret data and create interactive visualizations but also facilitates a deeper understanding of business analytics. Through its powerful data analysis features, collaboration tools, and accessibility, IBM Cognos Analytics empowers organizations to harness their data for actionable business insights, positioning itself as a formidable alternative to Tableau in the competitive landscape of BI software.
Looker: Elevating Data Analytics with Modern BI
Looker emerges as a compelling alternative among the tableau of business intelligence tools, offering a fresh perspective on data analysis and visualization via business intelligence software.

It integrates seamlessly into the modern data-driven business environment, providing a robust platform for data analysts and business teams alike.
- Streamlined Data Exploration: Looker’s innovative approach to data visualization and exploration simplifies the process of deriving insights from complex datasets. It enables users to create interactive dashboards and visualizations that are both informative and engaging, enhancing the decision-making process with rich, actionable insights.
- Unified Data Modeling: Central to Looker’s appeal is its powerful data modeling layer, which allows data teams to define and manage data sources with ease. This ensures consistency and reliability in data analysis, enabling teams to interpret data confidently across various business units.
- Collaborative Data Analysis: Looker fosters a collaborative analytics environment, where sharing and discussion of business insights are encouraged through its intuitive collaboration tools. Teams can easily share interactive reports and dashboards, promoting a culture of data-driven decision-making.
- Advanced Business Intelligence: With a focus on advanced analytics, Looker goes beyond traditional reporting to offer insights into business analytics that can transform strategic planning. It supports complex data analysis, including predictive modeling and machine learning, to provide a deeper understanding of business dynamics.
- Seamless Integration and Scalability: Looker integrates effortlessly with a wide array of data sources, ensuring that organizations can leverage all their data for insights. Its scalability addresses the growing demands of businesses, adapting to increased data volumes and more sophisticated analytics needs without compromising performance.
- Accessibility and User Empowerment: Designed with the user in mind, Looker demystifies data analysis, making it accessible to users regardless of their technical expertise. Its intuitive interface and self-service capabilities empower business users to explore data, create dashboards, and extract insights independently.
- Robust Security and Free Trial: Security is a paramount concern for Looker, which offers robust data protection features to safeguard sensitive information. Additionally, a free trial allows organizations to assess Looker’s capabilities and fit within their operational ecosystem before making a commitment.
A Forward-Thinking BI Platform
Looker stands as a visionary tool in the business intelligence landscape, challenging conventional data analysis and visualization paradigms.
It encapsulates the essence of modern BI, offering a blend of advanced analytics, user-friendly design, and collaborative features.
This tableau alternative caters to the evolving needs of dynamic businesses, providing a scalable, secure, and accessible platform for harnessing the power of data.
Through Looker, organizations unlock new dimensions of business intelligence, driving innovation and strategic growth with data at the forefront.
Sisense: Transforming Data into Insights with Ease
Sisense strides confidently into the arena of Tableau alternatives, showcasing its prowess as a formidable business intelligence software designed for complex data analysis and intuitive data visualizations.

It’s a platform that prides itself on turning data into actionable insights with unparalleled ease, serving the needs of data analysts, engineers, and business teams across various industries.
- Holistic Data Integration: Sisense excels in integrating data from disparate sources, offering a unified platform for analyzing and visualizing complex datasets. Whether the data is stored in cloud-based systems, on-premises databases, or in IoT devices, Sisense provides a comprehensive view, ensuring that every piece of data is accounted for in the analysis.
- Advanced Analytical Engine: At the heart of Sisense’s capabilities is its advanced analytical engine, designed to handle massive volumes of data without sacrificing performance. This allows for real-time data processing and analysis, enabling businesses to react swiftly to emerging trends and insights among all Tableau alternatives.
- Customizable Interactive Dashboards: With Sisense, creating interactive dashboards that cater to specific business needs is straightforward. Its drag-and-drop interface allows users to customize visualizations, embedding advanced analytics and interactive elements to convey complex information in an accessible way.
- Empowering Data Teams with Collaboration: Collaboration is key in the data-driven decision-making process, and Sisense facilitates this through its built-in collaboration tools. Data teams can share insights, interactive reports, and dashboards effortlessly, ensuring that actionable intelligence is distributed across the organization efficiently.
- Scalability and Flexibility: Sisense is built to scale, accommodating the growing data needs of businesses without degradation in performance. Its flexible architecture supports a wide range of BI applications, from embedded analytics within customer-facing apps to comprehensive enterprise analytics solutions.
- User-Friendly Experience: Targeting both technical and non-technical users, Sisense offers an intuitive experience that reduces the complexity often associated with data analysis. Its self-service capabilities empower users to explore data, generate reports, and derive insights without deep technical expertise.
- Security and Compliance: Recognizing the importance of data security, Sisense implements stringent security measures to protect sensitive information. Moreover, businesses can take advantage of a free trial to explore the platform’s features and ensure it meets their specific requirements before committing.
A Comprehensive Business Intelligence Solution
Sisense stands out as a comprehensive solution for businesses seeking an alternative to Tableau that doesn’t compromise on power or ease of use.
It combines robust data integration capabilities, advanced analytics, and user-friendly design to create a platform that not only simplifies the process of deriving insights from data but also enhances the decision-making process.

Whether for interactive dashboards, real-time data analysis, or collaborative data exploration, Sisense offers a versatile and scalable solution that caters to the ever-evolving needs of modern businesses.
